
CH 04 · Official Desktop App
Chapter Goal
This chapter covers a second way to start with dsh — the official desktop app. It's a standalone application with the Node, pnpm, and Python runtimes all bundled in. You don't need to install any environment on your machine beforehand; just download the installer, double-click it, and you get the full interface. When you're done you'll be able to: explain how it differs from the npm install, install it on Windows / macOS, and run your first task with a DeepSeek account or an API Key.
Why a desktop app
CH 03 uses an npm global install: install Node, run commands, open the interface in a browser. That suits developers, but it's unfriendly to ordinary users who don't want to touch the command line. On September 24, 2026 the official team released the desktop installer (the 20260924 in the installer version is the release date) — an Electron shell around the full Web UI, same interface as the web version, with the whole runtime bundled into one standalone app.
In one sentence: the desktop app is dsh as a standalone application. It reads and writes the same ~/.dsh data directory as the web version — sessions you created and models you configured in the web version are all still there when you open the desktop app, and vice versa. This is an officially maintained product, not a community third-party shell. Just make sure you download it from the official domain.
Before you start: you only need two things
- A computer with internet — Windows 10/11 or an Apple-silicon Mac.
- A DeepSeek account or API Key — the desktop app lets you log in with an account and run tasks directly, no need to apply for a Key in advance; going the open-platform Key route works too.
Node.js is not needed. This is the complete opposite of CH 03 and the biggest win of the desktop app.
Download the installer
The installers live on the official download domain download.deepseek.com/dsh-desk/. Stick to this domain and you won't grab a fake. For now the official team only packages these two platforms:
| Platform | Installer | Size |
|---|---|---|
| Windows 10/11 (x64) | deepseek-harness-0.1.7-rc.1.20260924.1-win-x64.exe | ~307 MB |
| macOS (Apple silicon) | deepseek-harness-0.1.7-rc.1.20260924.1-mac-arm64.dmg | ~365 MB |
Intel-Mac and Linux users will have to wait a little longer — only these two packages are out right now.
Install on Windows
- Double-click the downloaded
.exeinstaller and follow the wizard all the way through "Next". - If a Windows SmartScreen prompt appears (common for new apps), click More info → Run anyway.
- When it's done, launch DeepSeek Harness from the Start menu or the desktop shortcut.
Install on macOS
- Double-click the
.dmgand drag DeepSeek Harness into Applications. - If Gatekeeper blocks the first launch (saying "can't verify the developer"), open System Settings → Privacy & Security and click Open Anyway.
The macOS package is signed with a developer certificate under the company entity "杭州深度求索人工智能" (Hangzhou DeepSeek AI) and has passed Apple's official notarization, so it's safe to install.
First launch
Open the app and you're in the same full interface as the web version. In the bottom-left of the desktop app you can log in with your DeepSeek account: once logged in you can see your balance, check usage, top up directly, and an extra set of "DeepSeek account" models shows up in the model list — you run tasks with your account balance, no need to separately apply for an API Key on the open platform, which is the least hassle for beginners. If you'd rather not log in, go to Settings → Model in the bottom-left and fill in a Key; both paths work.
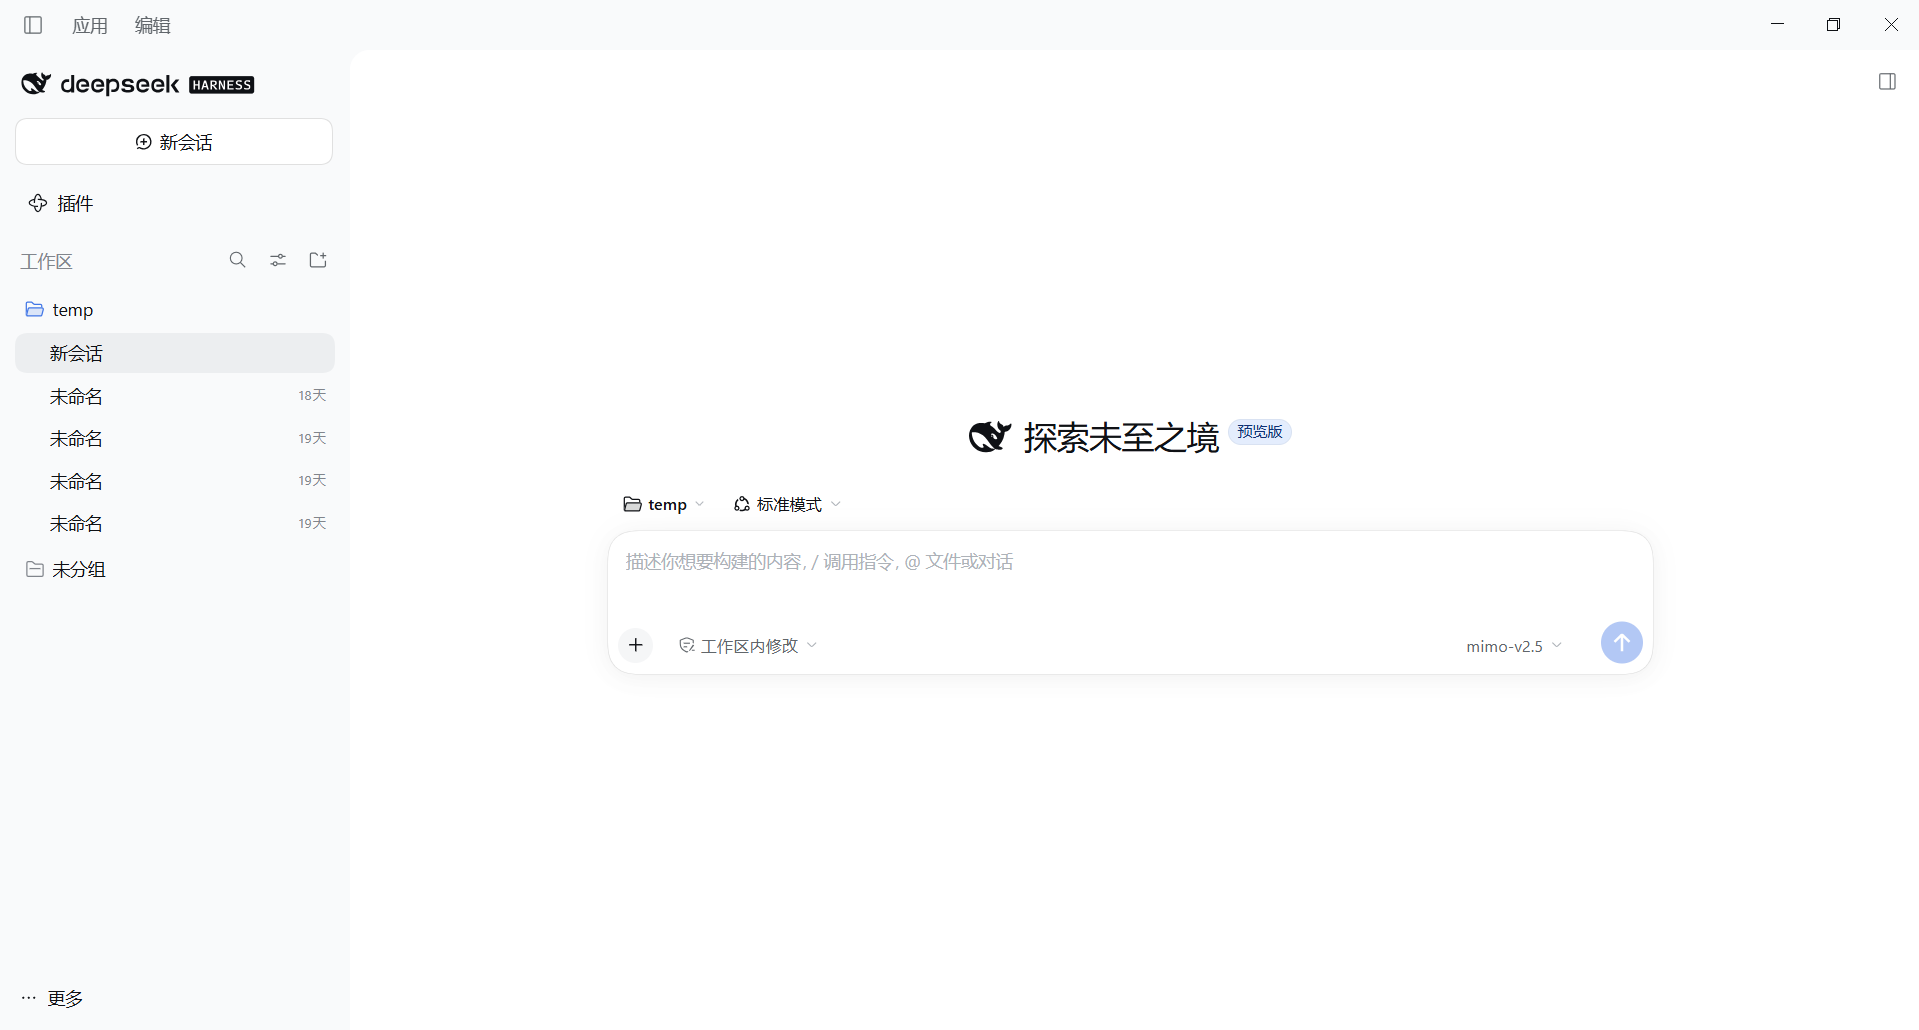
The main screen on first launch
This is the whole interface you see after opening the app: the workspace and session list on the left, the main input area on the right, and the model you're about to use in the bottom-right (the version in this screenshot uses mimo-v2.5). The input box already shows the hint on how to write prompts — use / to invoke commands and @ to reference a file or conversation. This is a real screenshot from a local test:
The desktop app has auto-update: roughly every 10 minutes it reads an update manifest from the official servers (Windows uses
nightly.yml, macOS usesnightly-mac.yml), and when a new version is available it notifies you automatically — no manual upgrade like npm.
Desktop app or npm, which to pick
| npm global install (CH 03) | Official desktop app (this chapter) | |
|---|---|---|
| Environment dependency | Needs Node.js (22.19+ / 24+) | None, Node/pnpm/Python all bundled |
| Interface | Open 127.0.0.1:3080 in a browser | Standalone app window |
| Login | API Key only | Key, or DeepSeek account login |
| Headless on CLI | Supported (covered in CH 06) | Interface-driven operations |
| Best for | Developers writing scripts/CI and running headless often | Ordinary users who want plug-and-play without touching commands |
If you're a beginner or don't want to fiddle with environments, go straight for the desktop app; if you later want headless automation and scheduled tasks, adding the npm route isn't a conflict either — the two share the same ~/.dsh data.
Once the desktop app is installed, just follow the "first-time setup, run your first task" steps from CH 03 — the interface is the same.
Troubleshooting (desktop app)
| Symptom | Fix |
|---|---|
| Windows shows SmartScreen / unknown publisher | Click "More info → Run anyway", and confirm you downloaded from the official download.deepseek.com/dsh-desk/ |
| macOS says can't verify the developer | System Settings → Privacy & Security → Open Anyway |
| Blank / stuck screen after opening | First launch initializes the bundled runtime, wait a bit longer, or restart the app |
| Never gets an update | Check you can reach the official servers; auto-update reads nightly.yml / nightly-mac.yml |
Security note: the desktop app reads and writes local
~/.dshdata, and account login stores the credential locally. Don't tick "remember login" on a public computer; if you suspect a leak, change the password or revoke and re-create on the platform.
What you learned in this chapter
If you can do the following on your own, you pass:
- [ ] Explain the difference between the desktop app and the npm install (one bundles the environment, the other needs Node)
- [ ] Download the installer for your system from the official
download.deepseek.com/dsh-desk/and install it - [ ] Launch the desktop app, log in with a DeepSeek account (or fill in an API Key), and run your first task